
Collect and represent data to show the incidence, prevalence and mortality rates of non-infectious diseases, for example:
- Nutritional diseases
- Diseases caused by environmental exposure
Incidence, Prevalence and Mortality rates of Hypertension:
- Incidence:
- In an earlier analysis of the Framingham Heart Study cohort (n = 5209, follow up= 30 years), the incidence of hypertension over a 30-year period increased with age in both genders (31). Between the ages of 30–39 years, the 2-year incidence rates were 3.3% in men and 1.5% in women, and between 70–79 years of age, the 2-year hypertension incidence rates were 6.2% in men and 8.6% in women.
- Prevalence:
- Prevalence of Hypertension by Sex
- The age-adjusted prevalence of hypertension was 34%, 25.4%, and 23.2% for men and 31%, 21%, and 21.6% for women among blacks, whites, and Mexican Americans, respectively.
- NHANES III reported the prevalence of hypertension was 12% for white men and 5% for white women aged 18-49 years.
- Prevalence of Hypertension by Race or Ethnicity
- Black individuals have a higher prevalence and incidence of hypertension than white persons. The prevalence of hypertension has been reported to be increased by 50% in blacks.
- In comparative assessments of black people and Asians, strokes are more common in black people, but coronary heart disease is more common in Asians. Both groups have a higher incidence of chronic renal failure than white people, but this is more due to hypertension in black people and diabetes in Asians.
- Mortality Rate:
- Prevalence of Hypertension by Sex
- Incidence:
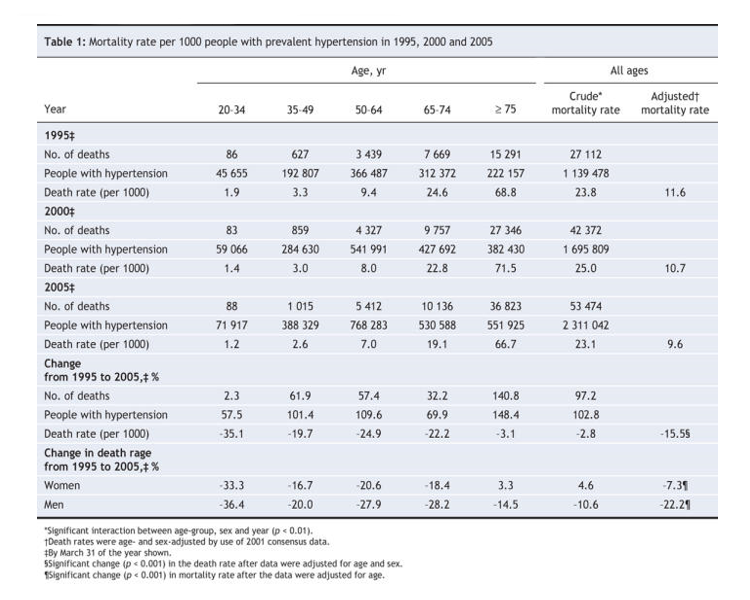
Image taken from https://www.ncbi.nlm.nih.gov/pmc/articles/PMC2374869/
[All data have been collected fromhttps://emedicine.medscape.com/article/1928048-overview
https://www.annualreviews.org/doi/abs/10.1146/annurev.publhealth.27.021405.102132?journalCode=publhealth
https://www.ncbi.nlm.nih.gov/pmc/articles/PMC2374869/]
Incidence, Prevalence and Mortality rates of Asthma:
- Incidence:
- In 2011, the age-standardized incidence rate of asthma for all ages and both sexes was 3.86 (3.67, 4.04) per 1,000 population.
- Between 1996 and 2011, asthma incidence rates decreased for all age groups.
- The largest decreases in incidence were observed between 2005 and 2008, particularly among young children under the age of five. This steep drop in asthma incidence between 2005 and 2008 corresponds with an improvement in air quality over the same time period.
- Prevalence:
- Incidence:
| Characteristic** | Number with Current Asthma (in thousands) | Percent with Current Asthma |
|---|---|---|
| Total | 26,515 | 8.3 |
| Child (Age < 18 years) | 6,132 | 8.3 |
| Adult (Age 18+ years) | 20,383 | 8.3 |
| All Age Groups | ||
| 0-4 years | 767 | 3.8 |
| 5-14 years | 4,141 | 10.1 |
| 15-19 years | 2,085 | 10.0 |
| 20-24 years | 1,993 | 9.5 |
| 25-34 years | 3,087 | 7.1 |
| 35-64 years | 10,914 | 8.8 |
| 65+ years | 3,529 | 7.4 |
- Mortality Rate:
| Characteristic | Number of Deaths* | Death Rate*,** per million |
|---|---|---|
| Total | 3,518 | 10.0 |
| Child (Age < 18 years) | 209 | 2.8† |
| Adult (Age 18+ years) | 3,309 | 13.3† |
| Race | ||
| White NH | 2,042 | 8.2 |
| Black NH | 951 | 23.3 |
| Other NH | 174 | 8.5 |
| Hispanica | 334 | 7.8 |
| Sex | ||
| Males | 1,356 | 8.5 |
| Boys (Age < 18 years) | 128 | 3.4† |
| Men (Age 18+ years) | 1,228 | 10.1† |
| Females | 2,162 | 11.2 |
| Girls (Age < 18 years) | 81 | 2.2† |
| Women (Age 18+ years) | 2,081 | 16.3† |
Note: NH = Non-Hispanic
*Underlying cause of death is asthma
**Population-based rates are age-adjusted to the 2000 standard population
†Rates not age-adjusted
aInformation for Hispanic origin was missing for 17 deaths
https://www.simcoemuskokahealth.org/health-stats/HealthStatsHome/ChronicDiseases/ChronicRespiratoryDisease]
Extract from HSC Biology Stage 6 Syllabus. © 2017 Board of Studies NSW.
EasyBio > Non-infectious Disease and Disorders > Causes and Effects > Collect and represent data to show the incidence, prevalence and mortality rates of non-infectious diseases
Collect and represent data to show the incidence, prevalence and mortality rates of non-infectious diseases, for example:
- nutritional diseases
- diseases caused by environmental exposure
Incidence, Prevalence and Mortality rates of Hypertension:
- Incidence:
- In an earlier analysis of the Framingham Heart Study cohort (n = 5209, follow up= 30 years), the incidence of hypertension over a 30-year period increased with age in both genders (31). Between the ages of 30–39 years, the 2-year incidence rates were 3.3% in men and 1.5% in women, and between 70–79 years of age, the 2-year hypertension incidence rates were 6.2% in men and 8.6% in women.
- Prevalence:
- Prevalence of Hypertension by Sex
- The age-adjusted prevalence of hypertension was 34%, 25.4%, and 23.2% for men and 31%, 21%, and 21.6% for women among blacks, whites, and Mexican Americans, respectively.
- NHANES III reported the prevalence of hypertension was 12% for white men and 5% for white women aged 18-49 years.
- Prevalence of Hypertension by Race or Ethnicity
- Black individuals have a higher prevalence and incidence of hypertension than white persons. The prevalence of hypertension has been reported to be increased by 50% in blacks.
- In comparative assessments of black people and Asians, strokes are more common in black people, but coronary heart disease is more common in Asians. Both groups have a higher incidence of chronic renal failure than white people, but this is more due to hypertension in black people and diabetes in Asians.
- Mortality Rate:
- Prevalence of Hypertension by Sex
- Incidence:
Image taken from https://www.ncbi.nlm.nih.gov/pmc/articles/PMC2374869/
[All data have been collected fromhttps://emedicine.medscape.com/article/1928048-overview
https://www.annualreviews.org/doi/pdf/10.1146/annurev.publhealth.27.021405.102132
https://www.ncbi.nlm.nih.gov/pmc/articles/PMC2374869/]
Incidence, Prevalence and Mortality rates of Asthma:
- Incidence:
- In 2011, the age-standardized incidence rate of asthma for all ages and both sexes was 3.86 (3.67, 4.04) per 1,000 population.
- Between 1996 and 2011, asthma incidence rates decreased for all age groups.
- The largest decreases in incidence were observed between 2005 and 2008, particularly among young children under the age of five. This steep drop in asthma incidence between 2005 and 2008 corresponds with an improvement in air quality over the same time period.
- Prevalence:
- Incidence:
| Characteristic** | Number with Current Asthma (in thousands) | Percent with Current Asthma |
|---|---|---|
| Total | 26,515 | 8.3 |
| Child (Age < 18 years) | 6,132 | 8.3 |
| Adult (Age 18+ years) | 20,383 | 8.3 |
| All Age Groups | ||
| 0-4 years | 767 | 3.8 |
| 5-14 years | 4,141 | 10.1 |
| 15-19 years | 2,085 | 10.0 |
| 20-24 years | 1,993 | 9.5 |
| 25-34 years | 3,087 | 7.1 |
| 35-64 years | 10,914 | 8.8 |
| 65+ years | 3,529 | 7.4 |
- Mortality Rate:
| Characteristic | Number of Deaths* | Death Rate*,** per million |
|---|---|---|
| Total | 3,518 | 10.0 |
| Child (Age < 18 years) | 209 | 2.8† |
| Adult (Age 18+ years) | 3,309 | 13.3† |
| Race | ||
| White NH | 2,042 | 8.2 |
| Black NH | 951 | 23.3 |
| Other NH | 174 | 8.5 |
| Hispanica | 334 | 7.8 |
| Sex | ||
| Males | 1,356 | 8.5 |
| Boys (Age < 18 years) | 128 | 3.4† |
| Men (Age 18+ years) | 1,228 | 10.1† |
| Females | 2,162 | 11.2 |
| Girls (Age < 18 years) | 81 | 2.2† |
| Women (Age 18+ years) | 2,081 | 16.3† |
Note: NH = Non-Hispanic
*Underlying cause of death is asthma
**Population-based rates are age-adjusted to the 2000 standard population
†Rates not age-adjusted
aInformation for Hispanic origin was missing for 17 deaths
http://www.simcoemuskokahealthstats.org/topics/chronic-diseases/asthma/prevalence-and-incidence]
Extract from HSC Biology Stage 6 Syllabus. © 2017 Board of Studies NSW.